6.3.1 Emissions by item (Studio and Productions)
Side panel > Studio/Production > Results
The pie chart displayed in the reports shows the breakdown of carbon emissions by category. Each label corresponds to a data category entered in Carbulator.
Tip : You can hide an emission category by clicking on its label in the legend. The total and the percentage are then automatically recalculated.
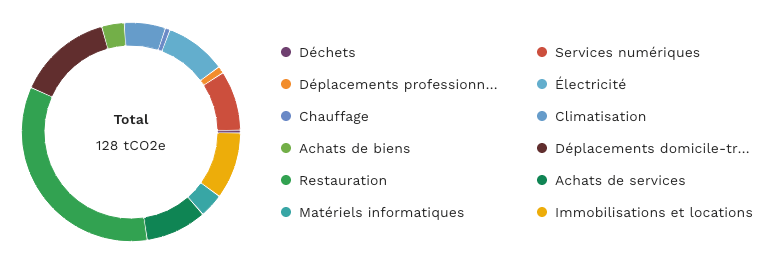
Legend for the “Studio” and “Work” Chart:
- ÉLECTRICITY: Emissions related to total electricity consumption, including heating and cooling of the premises if not broken down separately
- Total electricity consumption (kWh/year)
- HEATING: Emissions related to the use of heating
- Electricity used for heating—if broken down separately from total consumption (kWh/year)
- Natural gas, propane, heating oil (kWh PCI/year)
- Wood pellets (kg/year)
- District heating (kWh/year)
- AIR CONDITIONING: Emissions related to the use of air conditioning
- Electricity used for air conditioning—if separate from total consumption (kWh/year)
- District cooling (kWh/year)
- Refrigerant refills (kg/year)
- BUSINESS TRAVEL: Carbon emissions from business travel related to a studio or a production
- Travel using the company’s vehicle fleet
- Travel using external vehicles
- COMMUTING: Emissions related to employees’ commuting habits to the studio
- Trains, Cars and Motorcycles, Public Transportation, Active Transportation (km/week)
- CATERING: Impact of meals and hot beverages consumed by employees
- Meals: predominantly vegetarian, fish, chicken—white meat, beef, mixed (meals/week)
- PURCHASES OF GOODS: Emissions associated with routine operating expenses
- Reams of paper (number / year)
- Small office supplies (€ excl. tax / year)
- Office supplies (€ excl. tax / year)
- Cardboard (kg / year)
- Municipal water: drinking water supply + wastewater treatment (m³ / year)
- PURCHASES OF SERVICES: Emissions associated with purchased services
- Accommodation / Catering / Event planning (€ excl. tax / year)
- Banking, insurance, legal counsel, external services (€ excl. tax / year)
- Communication, advertising, marketing (€ excl. tax / year)
- Documentation (€ excl. tax / year)
- Studies and research (€ excl. tax / year)
- Postal coasts (€ excl. tax / year)
- Building maintenance (€ excl. tax / year)
- Telecommunications (€ excl. tax / year)
- DIGITAL SERVICES:
- Audio conferencing (hours / person / day)
- Video conferencing (hours / person / day)
- Emails sent (emails / person / day)
- Video streaming (hours / person / day)
- Audio streaming and podcasts (hours / person / day)
- Cloud storage (GB / year)
- Data transfer – combined downloads and uploads (GB / year)
- External physical hosting (GB / year)
- IT EQUIPMENTS: emissions related to computer hardware owned by the studio
- Equipment listed in the Inventory section of Carbulator, calculated based on its acquisition and depreciation periods.
- FIXED ASSETS AND LEASES: emissions related to the physical occupancy of workspaces (whether owned or leased)
- Office and parking space area (m²), Garage area (m²)
- Machinery and equipment—excluding IT (€ excl. tax)
- Furniture and other manufactured goods (€ excl. tax)
- Vehicle purchases: total weight of the vehicle fleet (metric tons)
- Premises renovation work (€ excl. tax / year)
- WASTE: Impact related to the generation and treatment of waste by type
- Paper and cardboard (kg/year),
- Plastic packaging (kg/year),
- Residual household waste (kg/year),
- Waste electrical and electronic equipment (kg/year)
- Wastewater (automatically linked to the purchase of municipal water)
6.3.2 Overview Charts
Side panel > Overview
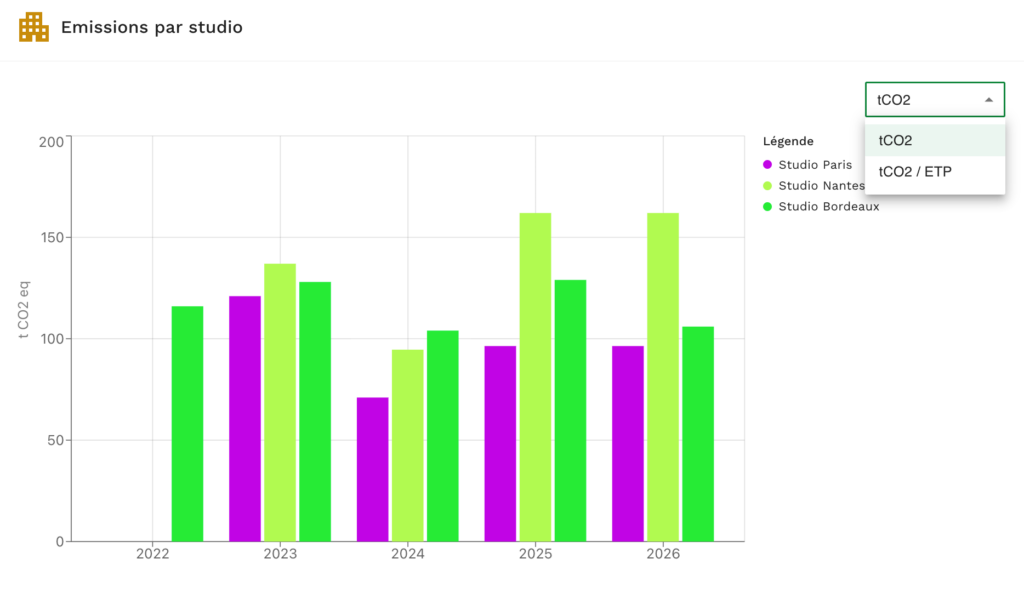
Report by Studio
This chart shows the year-over-year trend in carbon emissions for all studios. The data included corresponds to the datasets marked as the main version.
You can choose to display the results as Total CO2e or Total CO2e per FTE.
Emissions trend (detailed per studio)
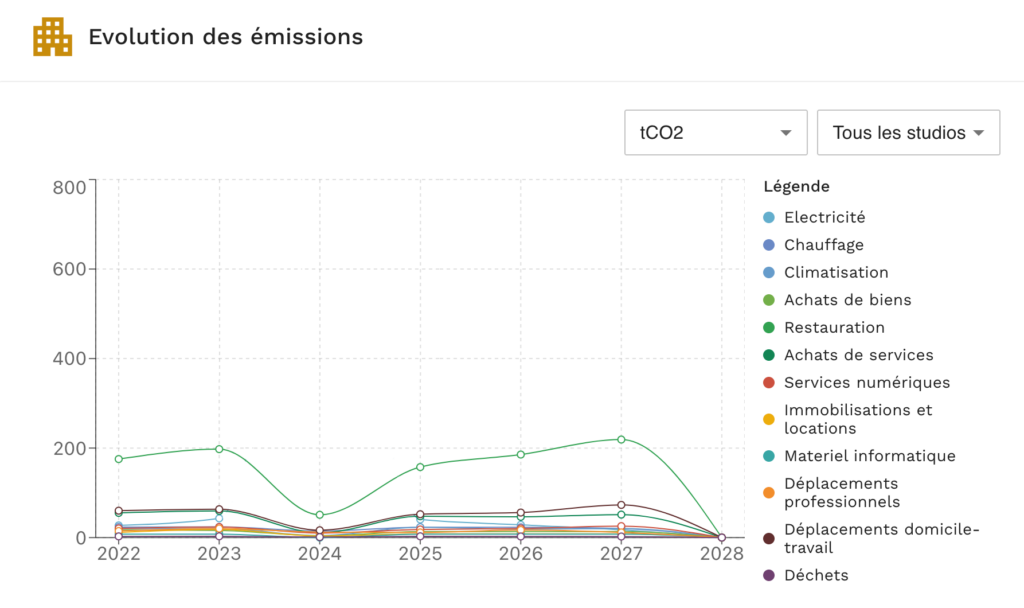
This chart shows the year-over-year trend in carbon emissions for all studios—broken down by emission category. The data used corresponds to the datasets marked as the main version.
TIP: You can hide an emission category by clicking on its label in the legend. The total and percentage ratio are then automatically recalculated.
The results are displayed as a “Total for All Studios” or individually for each studio, depending on your selection. You can also choose to display the results as “Total CO2e” or “Total CO2e per FTE.”
Report by production
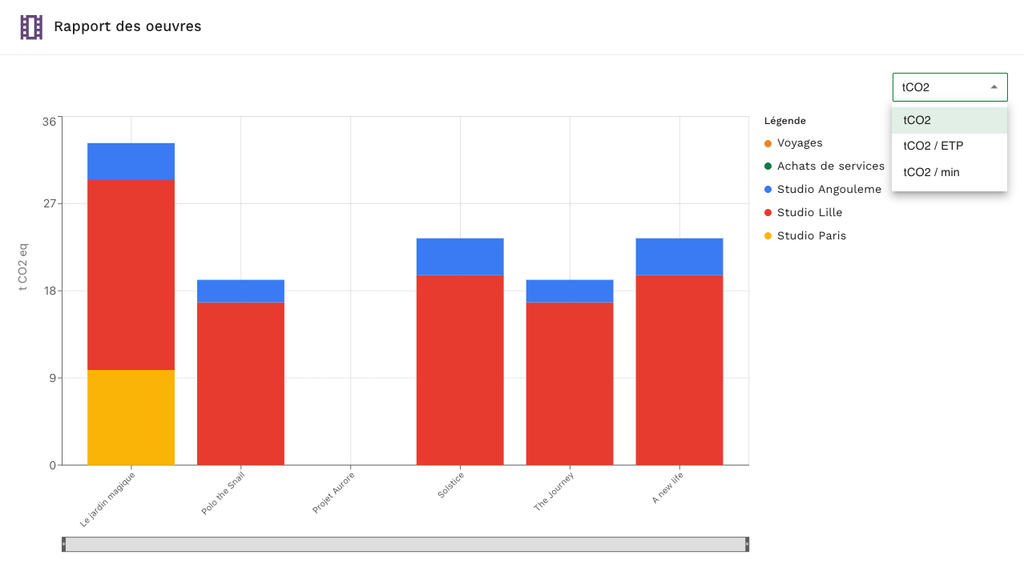
This chart allows you to visualize, for each project, the contribution of each studio (workgroup: people, machines, and contractors), as well as service purchases and business travel.
The results are displayed as a “Total for All Studios” or for each studio individually, depending on your selection. You can also choose to display the results as “Total CO2e,” “Total CO2e per FTE,” or “Total CO2e per Minute.”